Android Debugging Crash Course
Written on October 10, 2023 by Nicholas Lim (niclimcy) & Nolen Johnson (npjohnson)

Glossary
- ADB: Android Debug Bridge.
- Buffer: A fixed size storage area in memory.
- CLI: Command-line interface.
- Commits: An atomic change to a codebase, used for version control.
- Debugging: The process of finding and fixing errors, bugs, and unintended behavior.
- Device block files: Special files in the /dev directory that allow for standardized interaction with kernel drivers.
- DTS: Device Tree Source.
- EDL: Qualcomm’s Emergency Download mode.
- gdb: GNU Debugger.
- HAL: Hardware Abstraction Layer.
- Kernel Space: Space where kernel runs and interacts with device drivers.
- Logging: Recording and storing events that occur when running software, such as error messages, warnings, and debugging information.
- Memory Address: A unique identifier that specifies the location in memory where data or instructions are stored.
- OEM: Original equipment manufacturer (e.g., Google, Fairphone, Samsung, etc.).
- PID: Process ID.
- pstore: Persistent Store.
- Rebase: The process of moving commits from one branch to another branch.
- Stack Trace: Shows the sequence of function calls that led to an error or exception in a program.
- TID: Thread ID.
- UART: Universal Asynchronous Receiver / Transmitter.
- User Space: Space where normal user processes run, such as applications.
What is Debugging?
To understand Android debugging, it is important to understand the different parts of the Android system. At a high level, the Android system is made up of three main components: apps, the platform, and the kernel.

User Space Debugging
User space debugging allows us to find and fix app and platform issues. This process can be fairly straightforward on Android if we use the right tools.
ADB
The Android Debug Bridge (ADB) allows us to access a device’s CLI (or shell), letting us use native debugging tools like Logcat. See our wiki on how you can start Using ADB and fastboot on your devices.
logcat
logcat is a CLI tool that outputs a log of system messages, including messages that you have written from your app with the Log class.
There are various circular buffers stored by the logcat process, and they can be accessed using the -b option, with the following options available:
radio: Views the buffer that contains radio/telephony related messages.events: Views the interpreted binary system event buffer messages.main: Views the main log buffer (default), which doesn’t contain system and crash log messages.system: Views the system log buffer (default).crash: Views the crash log buffer (default).all: Views all buffers.default: Reports main, system, and crash buffers.
You can find out more about how to use logcat on Android Developers.
Interpreting a crash buffer from logcat:
$ adb logcat -b crash
+--------------------+-----+-----+-------+-----------------------------------------------------------------------+
| Date  Time         | PID | TID | Level | ProcessName   : Message                                               |
+--------------------+-----+-----+-------+-----------------------------------------------------------------------+
| 04-14 11:22:34.256 | 5199| 5199| E     | AndroidRuntime: FATAL EXCEPTION: main                                 |
| 04-14 11:22:34.256 | 5199| 5199| E     | AndroidRuntime: Process: com.android.settings, PID: 5199              |
| 04-14 11:22:34.256 | 5199| 5199| E     | AndroidRuntime: java.lang.RuntimeException: Unable to resume activity |
|                    |     |     |       |            {com.android.settings/com.android.settings.SubSettings}:   |
|                    |     |     |       |            java.lang.ArrayIndexOutOfBoundsException length=7; index=7 |
+--------------------+-----+-----+-------+-----------------------------------------------------------------------+
The crash buffer is particularly useful for debugging app crashes (e.g., Settings has stopped), identifying runtime errors.
Tombstones
Sometimes the ADB service may not be running (possible reasons include a system process causing a reboot before adb has started). In such a case, we are not able to access the logcat command. Fret not, a tombstone file is written to /data/tombstones, which contains a stack trace leading up to the crash.
Tombstones are also more detailed, providing a longer stack trace if a logcat output is insufficient. It is hence also possible to export the tombstone from a running process using the following command:
$ adb shell debuggerd {PID}
Hint: Replace {PID} with the actual Process ID of the process you want.
Stack
stack is a Python script that represents crash dumps in a human readable format (symbolizes native crash dumps). You can find stack in any local sync of LineageOS repositories at ~/android/lineage/development/scripts/stack. You can run stack on an extracted tombstone using stack < /path/to/tombstone_0.
A native crash dump will usually look like this:
*** *** *** *** *** *** *** *** *** *** *** *** *** *** *** ***
Build fingerprint: 'Android/aosp_angler/angler:7.1.1/NYC/enh12211018:eng/test-keys'
Revision: '0'
ABI: 'arm'
pid: 17946, tid: 17949, name: crasher  >>> crasher <<<
signal 11 (SIGSEGV), code 1 (SEGV_MAPERR), fault addr 0xc
    r0 0000000c  r1 00000000  r2 00000000  r3 00000000
    r4 00000000  r5 0000000c  r6 eccdd920  r7 00000078
    r8 0000461a  r9 ffc78c19  sl ab209441  fp fffff924
    ip ed01b834  sp eccdd800  lr ecfa9a1f  pc ecfd693e  cpsr 600e0030

backtrace:
    #00 pc 0004793e  /system/lib/libc.so (pthread_mutex_lock+1)
    #01 pc 0001aa1b  /system/lib/libc.so (readdir+10)
    #02 pc 00001b91  /system/xbin/crasher (readdir_null+20)
    #03 pc 0000184b  /system/xbin/crasher (do_action+978)
    #04 pc 00001459  /system/xbin/crasher (thread_callback+24)
    #05 pc 00047317  /system/lib/libc.so (_ZL15__pthread_startPv+22)
    #06 pc 0001a7e5  /system/lib/libc.so (__start_thread+34)
Tombstone written to: /data/tombstones/tombstone_06
Running stack < /data/tombstones/tombstone_06 will show the following:
Revision: '0'
pid: 17946, tid: 17949, name: crasher  >>> crasher <<<
signal 11 (SIGSEGV), code 1 (SEGV_MAPERR), fault addr 0xc
     r0 0000000c  r1 00000000  r2 00000000  r3 00000000
     r4 00000000  r5 0000000c  r6 eccdd920  r7 00000078
     r8 0000461a  r9 ffc78c19  sl ab209441  fp fffff924
     ip ed01b834  sp eccdd800  lr ecfa9a1f  pc ecfd693e  cpsr 600e0030
Using arm toolchain from: ~/android/lineage/prebuilts/gcc/linux-x86/arm/arm-linux-androideabi-4.9/bin/

Stack Trace:
  RELADDR   FUNCTION                   FILE:LINE
  0004793e  pthread_mutex_lock+2       bionic/libc/bionic/pthread_mutex.cpp:515
  v------>  ScopedPthreadMutexLocker   bionic/libc/private/ScopedPthreadMutexLocker.h:27
  0001aa1b  readdir+10                 bionic/libc/bionic/dirent.cpp:120
  00001b91  readdir_null+20            system/core/debuggerd/crasher.cpp:131
  0000184b  do_action+978              system/core/debuggerd/crasher.cpp:228
  00001459  thread_callback+24         system/core/debuggerd/crasher.cpp:90
  00047317  __pthread_start(void*)+22  bionic/libc/bionic/pthread_create.cpp:202 (discriminator 1)
  0001a7e5  __start_thread+34          bionic/libc/bionic/clone.cpp:46 (discriminator 1)
stack works quite similarly to a Kernel Space Debugging tool, decode_stacktrace.sh. They both provide which exact file and line of the original code the Stack Trace is referencing. Keep on reading to find out more about how to use decode_stacktrace.sh.
ramoops-pmsg
ramoops-pmsg is a user space accessible version of ramoops. To access these logs prior to last reboot from pstore, you can run:
$ adb logcat -b all -L
A more detailed explanation of the ramoops kernel feature can be found below.
Kernel Space Debugging
Kernel space debugging helps us identify issues within the kernel. Device manufacturers, on top of providing device kernel drivers, may customize other parts of the kernel when releasing a device kernel source. As such, when a device maintainer rebases their device kernel on newer kernel versions (to keep up with security patches), regressions may occur.
dmesg
dmesg is a CLI tool that displays kernel buffer messages. It provides a detailed view of kernel-level activities, allowing device maintainers to diagnose system crashes, driver issues, and monitor system events. Do note that all LineageOS builds come with SELinux Enforcing by default, which requires you to be in adb root mode before using dmesg.
Example of a truncated dmesg output showing a NULL pointer dereference:
# adb shell dmesg
| Unable to handle kernel NULL pointer dereference at virtual address 0000000000000010
| Internal error: Oops: 96000006 [#1] SMP
| Call trace:
| update_insn_emulation_mode+0xc0/0x148
| emulation_proc_handler+0x64/0xb8
| proc_sys_call_handler+0x9c/0xf8
| proc_sys_write+0x18/0x20
| __vfs_write+0x20/0x48
| vfs_write+0xe4/0x1d0
| ksys_write+0x70/0xf8
| __arm64_sys_write+0x20/0x28
| el0_svc_common.constprop.0+0x7c/0x1c0
| el0_svc_handler+0x2c/0xa0
| el0_svc+0x8/0x200
ramoops
ramoops is a Linux Kernel feature that writes to memory before a system crashes. ramoops can be set-up in a device’s kernel device tree source (DTS), by reserving a memory buffer for ramoops-pmsg. It works in conjunction with the kernel pstore driver to save the ramoops to a persistent file at /sys/fs/pstore before a reboot.
An example of a ramoops configuration with a pmsg buffer allocated:
/{
    reserved-memory {
        ramoops: ramoops@b0000000 {
            compatible = "ramoops";
            reg = <0 0xb0000000 0 0x00400000>;
            record-size = <0x40000>; /*256x1024*/
            console-size = <0x40000>;
            ftrace-size = <0x40000>;
            pmsg-size = <0x200000>;
            ecc-size = <0x0>;
        };
    };
};
On newer kernels, ramoops can be enabled via the following config options:
CONFIG_PSTORE=y
CONFIG_PSTORE_CONSOLE=y
CONFIG_PSTORE_RAM=y
pstore is usually compressed by default, making it harder to use during debugging. You might want to disable it via:
# CONFIG_PSTORE_COMPRESS is not set
Although ramoops and pstore are powerful tools, there are some caveats to using them. Since pstore, by default, writes data as buffered, and we typically use it only when a system is about to crash, we tend to see a lot of corruption when retrieving a pstore afterwards.
addr2line
dmesg and ramoops often produces cryptic memory addresses in stack traces such as ffffff9405cebf10 from:
CFI failure (target: [\<\ffffff9405cebf10\>] __typeid__ZTSFvP10net_deviceE_global_addr+0x170/0x17c):
In this case, we can use Address To Line (addr2line) to find the specific file and line the issue is occurring using:
$ addr2line -e /path/to/kernel-module.o ffffff9405cebf10
decode_stacktrace.sh
decode_stacktrace.sh is a script bundled with every Linux Kernel source at linux/blob/master/scripts/decode_stacktrace.sh that makes use of addr2line. To use it, you first have to enable CONFIG_DEBUG_INFO=y in your kernel config and build the kernel.
Next you have to extract a call trace from dmesg of a kernel panic you are trying to debug and save it in a text file like this dmesg.txt here:
| update_insn_emulation_mode+0xc0/0x148
| emulation_proc_handler+0x64/0xb8
| proc_sys_call_handler+0x9c/0xf8
| proc_sys_write+0x18/0x20
| __vfs_write+0x20/0x48
| vfs_write+0xe4/0x1d0
| ksys_write+0x70/0xf8
| __arm64_sys_write+0x20/0x28
| el0_svc_common.constprop.0+0x7c/0x1c0
| el0_svc_handler+0x2c/0xa0
| el0_svc+0x8/0x200
Finally, point decode_stacktrace.sh to the dmesg.txt file you have created as well as the kernel you have compiled:
$ ./scripts/decode_stacktrace.sh /path/to/vmlinux /path/to/kernel-source-dir < dmesg.txt
As you can see in the following example (of a different stack trace), each call’s memory address in the stack trace has been replaced with a specific file and line of the code which you can then refer to with your kernel source.
| dump_stack (lib/dump_stack.c:52)
| warn_slowpath_common (kernel/panic.c:418)
| warn_slowpath_null (kernel/panic.c:453)
| _oalloc_pages_slowpath+0x6a/0x7d0
| ? zone_watermark_ok (mm/page_alloc.c:1728)
| ? get_page_from_freelist (mm/page_alloc.c:1939)
| __alloc_pages_nodemask (mm/page_alloc.c:2766)
Serial / gdb
Devices with UART ports (see older Nexuses/Google Pixels with 3.5mm headphone port, and newer Google Pixels with USB-C debuggers) can be connected using a UART cable to view kernel console messages (kgdb). With serial, you can debug issues that happen even before the kernel has started.
You can consider using serial when your device is for example stuck on the boot logo.
Desperate Debugging
If all else fails, you can use panic() in portions of the kernel you wish to debug. SebaUbuntu’s patch here demonstrates the use of panic() to catch early init issues.
Chipset Vendor / OEM Specific Debugging
Here are some custom debugging tools developed by OEMs we found over the years that have proved helpful.
EDL memorydump (qcom)
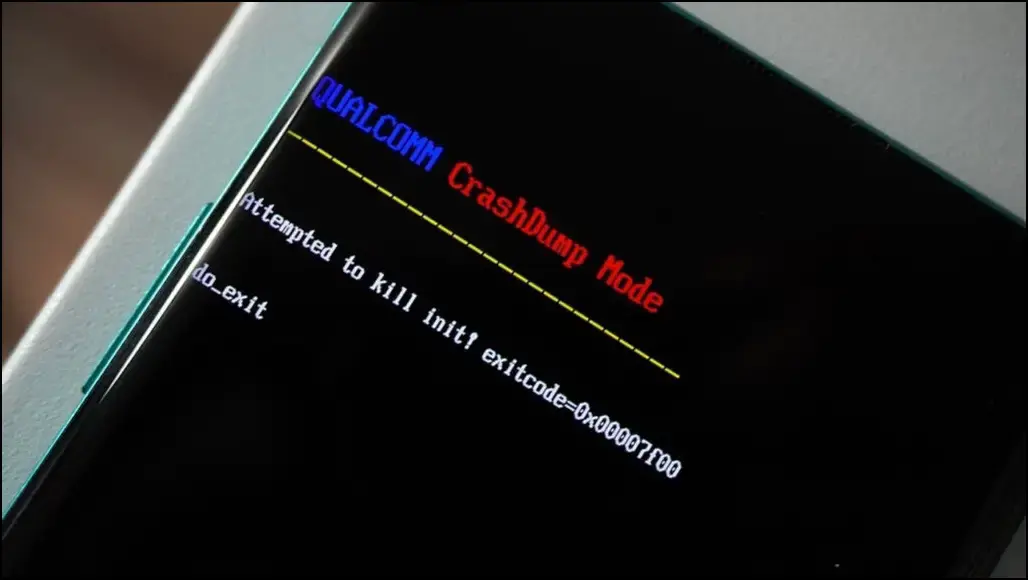
Some Qualcomm devices have CrashDump enabled, which allows you to use Qualcomm’s firehose tool to get a memorydump. As the firehose tool is closed source, we recommend using a rewritten open source version of the tool by Bjoern Kerler, which can be found here at bkerler/edl. You can retrieve a memory dump using edl memorydump.
/dev/block/by-name/debug (Samsung)
/dev/block/by-name/debug is a special device block file on Samsung devices that contains a stream of XBL logs, kernel logs, and more. You can run adb pull /dev/block/by-name/debug debug.bin to dump the stream of logs.
Example of the truncated debug.bin file:
{340532} ** XBL(1) **
{340532}
Format: Log Type - Time(microsec) - Message - Optional Info
Log Type: B - Since Boot(Power On Reset),  D - Delta,  S - Statistic
S - QC_IMAGE_VERSION_STRING=BOOT.XF.2.1-00133-SDM710LZB-3
S - IMAGE_VARIANT_STRING=SDM670LA
S - OEM_IMAGE_VERSION_STRING=21DJFC21
S - Boot Interface: eMMC
S - Secure Boot: On
S - Boot Config @ 0x00786070 = 0x000000c9
S - JTAG ID @ 0x00786130 = 0x100910e1
S - OEM ID @ 0x00786138 = 0x00200000
S - Feature Config Row 0 @ 0x007841a0 = 0x08d020000b588420
S - Feature Config Row 1 @ 0x007841a8 = 0xe0140000000311a0
S - Core 0 Frequency, 1516 MHz
S - PBL Patch Ver: 0
S - PBL freq: 600 MHZ
S - I-cache: On
S - D-cache: On
Our previous Engineering Blog on Qualcomm’s Chain of Trust goes into more detail about what eXtensible Bootloader (XBL) is.
Common errors (and how to solve them)
Now that we have a basic understanding of some of the debugging tools used during Android development, let’s now learn how to identify and fix common errors faced during debugging.
dlopen failed
Many devices have prebuilt libraries that are compiled with older versions of libraries that have dropped certain symbols. An error that might occur will look something like this:
* java.lang.UnsatisfiedLinkError: dlopen failed: cannot locate symbol "_ZN7android21SurfaceComposerClient11Transaction5applyEb" referenced by "/product/lib64/libsecureuisvc_jni.so"...
To solve this error, we require interpolating libraries that we colloquially refer to as “shims”. By intercepting calls to the missing functions and providing alternative implementations, we can essentially emulate the behavior of the original libraries built with the prebuilt libraries you may be using.
Alternatively, some modern devices opt to copy an older VNDK version of the updated library to $libname-v$vndkVersion.so, then patchelf the problematic library to load this versioned library.
You can check out the pre-existing shims that we have commonized here which were previously managed by individual device maintainers prior to LineageOS 20. For the example above, you can refer to this patch on how to use the shim packages for your prebuilt libraries that require them.
Hidden dlopen failed
As dlopen errors occur only during runtime, some of the failures do not immediately show up or are even hidden from logging. We have hence come up with a library hook, dlopen.so, that you can place in LD_PRELOAD that shows all linker operations, helping us see which libraries are currently missing any symbols or even missing dependencies.
Here is a log of a device using the library:
instantnoodlep / # LD_PRELOAD=dlopen.so /vendor/bin/hw/android.hardware.gnss\@2.1-service-qti
dlopen(libnetd_client.so) -> 0x0, errno: dlopen failed: library "libnetd_client.so" not found
dlopen(libgnss.so) -> 0xdc9f08e905187e63, errno: (null)
dlopen(liblbs_core.so) -> 0x618992fa4f6a1e6d, errno: (null)
dlopen(liblocdiagiface.so) -> 0x0, errno: dlopen failed: library "liblocdiagiface.so" not found
dlopen(libloc_net_iface.so) -> 0x0, errno: dlopen failed: library "libloc_net_iface.so" not found
dlopen([email protected]) -> 0xe8b09305c7a1c55f, errno: (null)
dlopen(libdataitems.so) -> 0xc4ba0f7c15946aef, errno: (null)
dlopen([email protected]) -> 0xd950565f49bbcc01, errno: (null)
dlopen(libgnss.so) -> 0xdc9f08e905187e63, errno: (null)
dlopen(libxtadapter.so) -> 0x39eb3dbc835592b5, errno: (null)
dlopen(libcdfw.so) -> 0x59b12f3c0b5e3e1b, errno: (null)
dlopen(libloc_socket.so) -> 0x2229c8abec54dac9, errno: (null)
Bonus
While working on non private system apps like Aperture, you could use Android Studio for easier testing and debugging!